fast sequential Markov coalescent
simulation of genomic data under complex evolutionary models
Visual inspection of the the validity of modeled scenarios
Building a complex model in par files can be difficult. Unfortunately,
we have not been able to provide an easy way to construct these input
files. However, we have written an R program called called ParFileViewer.r
to
help visualize the scenario you have modeled. It is an adaptaition and
extension of the previous script "parFileInterpreter" released with
version 2.6 of fastsimcoal2
executing the script
To do this you need to run the script from the R console or open it in RStudio and run it from there.
Alternatively, you can copy the script in the directory where you have
your par file and type the command
    Rscript
ParFileViewer.r 3PopExpBot20Mb-v2.par
This assumes that the program Rscript is in a folder in your path and
that your scenario is described in the file3PopExpBot20Mb-v2.par
Note that the script requires to install two non-default R
libraries: plotrix and diagram
By default, the scenario will be drawn in a pdf file called <par file name>.pdf, where <par file name> issimply the name of your par file.
In the above example, it would create a pdf file called test.par.pdf
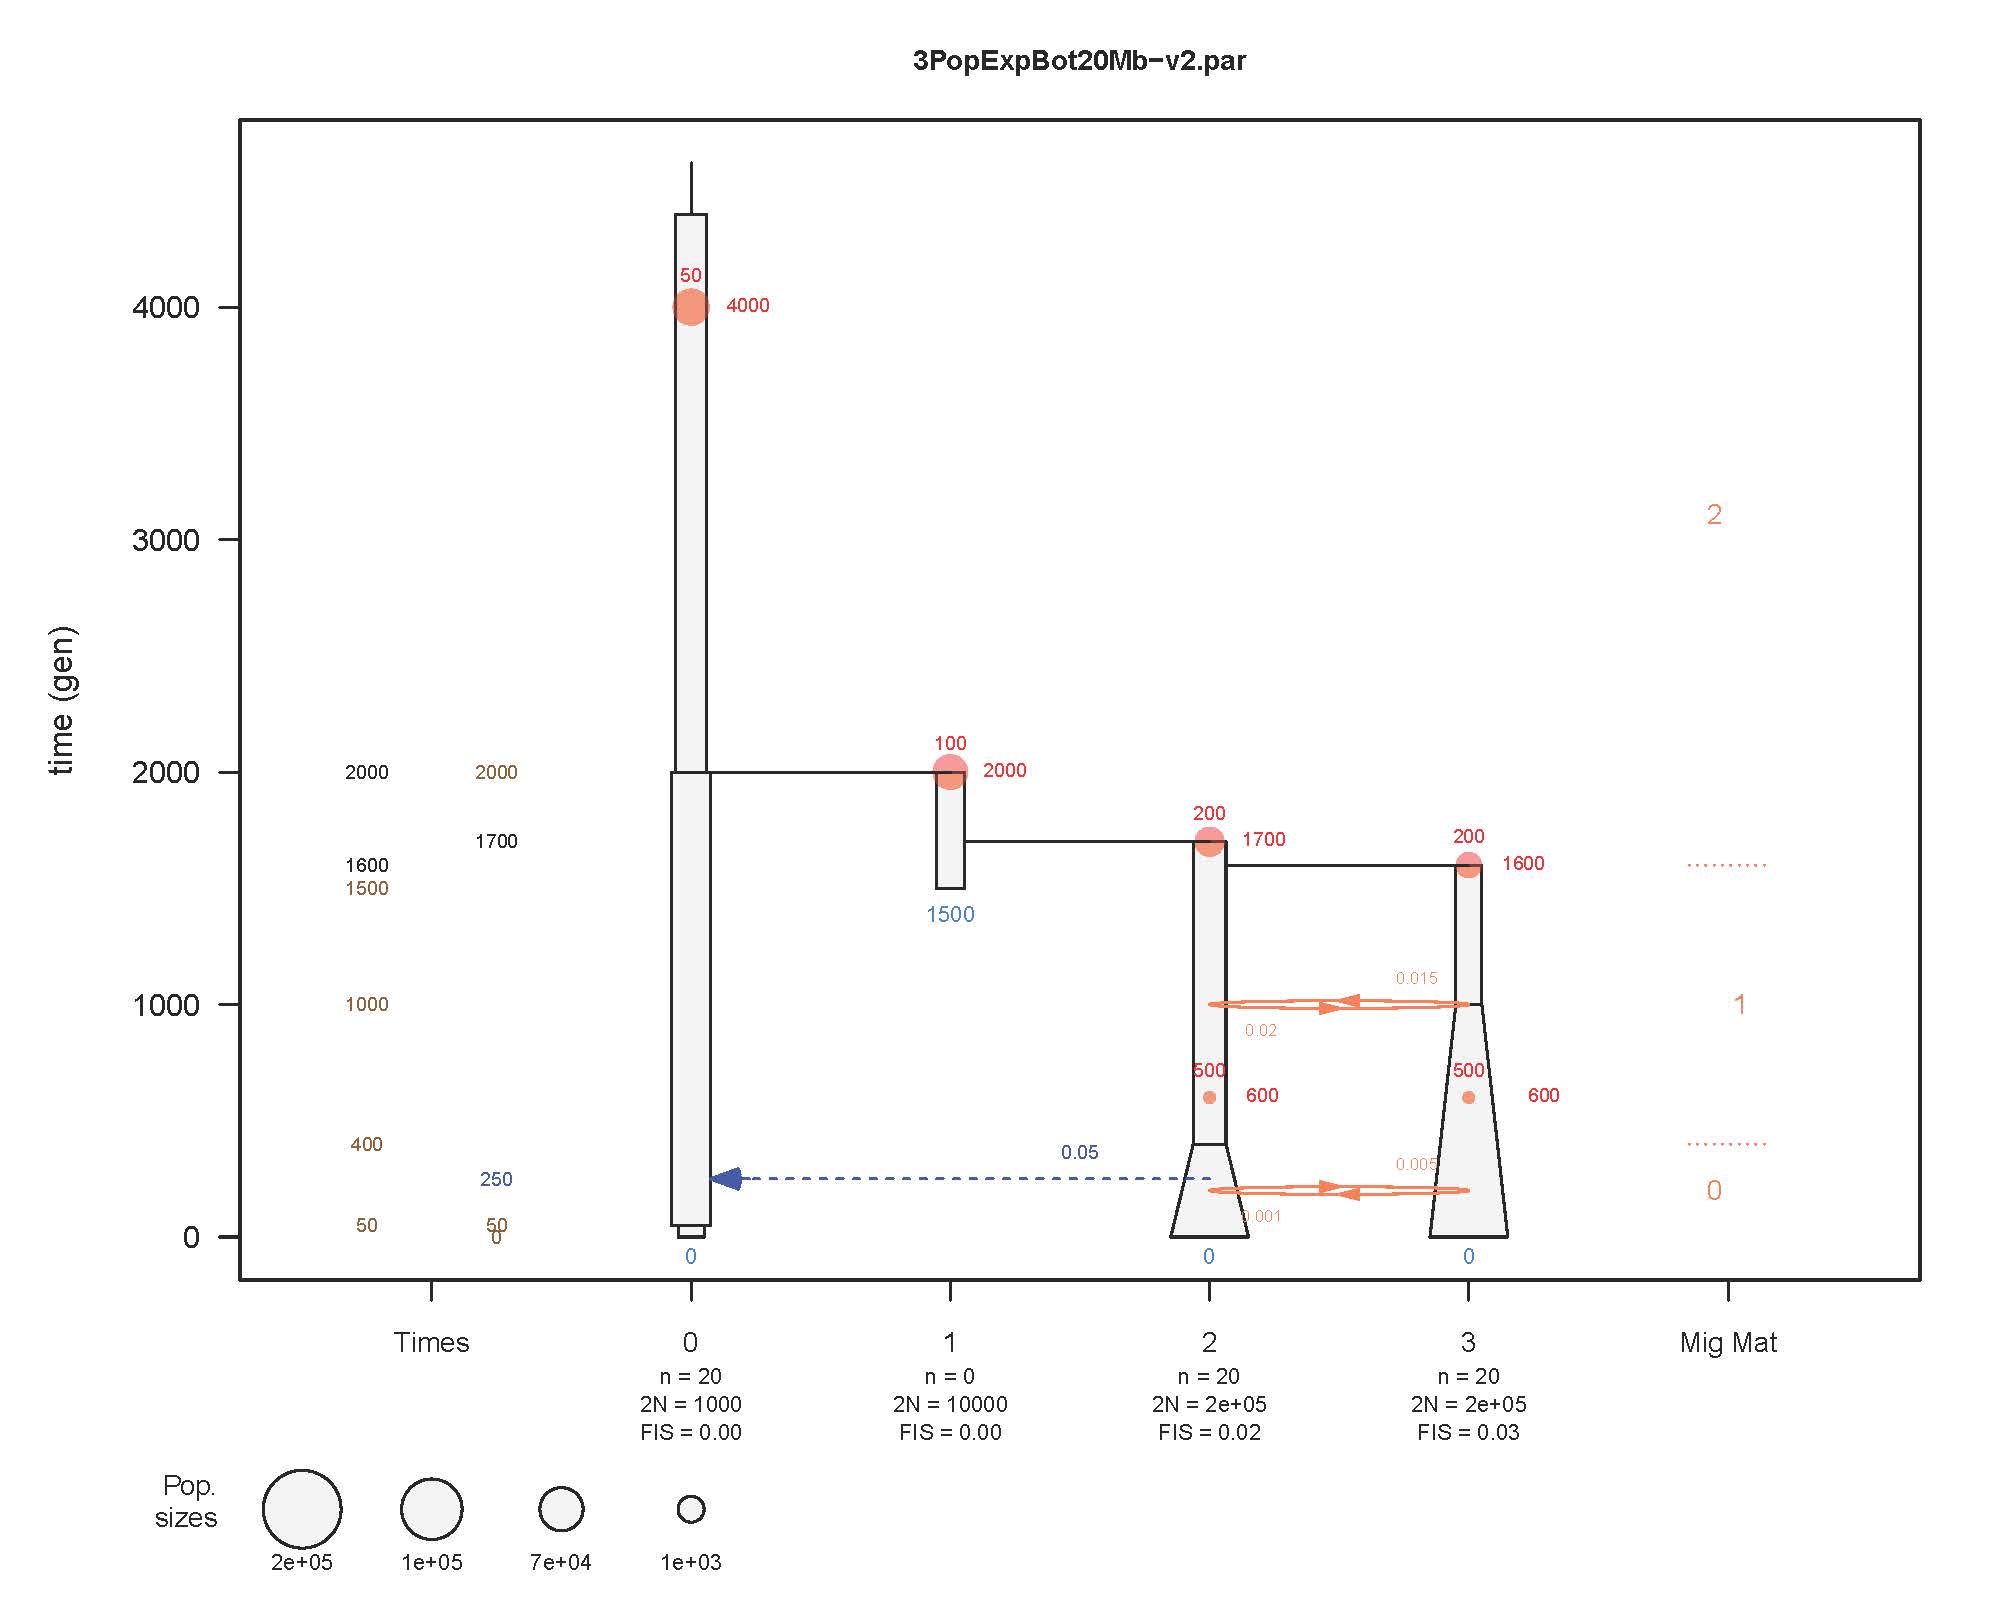
In this pdf, the different demes are represented by
vertical bars, the width of which is proportional to the populaiton
sizes. Below the x-axis, the demes are numbered according to the par
file. n stands for the sample sizes, and if n=o, this deme represents a
"ghost" population. We also report for each deme, its initial
size in haploid number (2N) and its initial inbreeding coefficient
(FIS). In additioon, the following texts and symbols are used:
The numbers in the leftmost column correspond to the times of
historical events, which can be population splits (in black), episodes
of gene flow (in blue), or population resizes (in brown).
The orange arrows between demes represent migration rates (in munits),
with direction indicating flow backward in time. Note that the
righttmost column indicates the migration matrix number used in the par
file at a given time.
The age of demes are shown in light blue below at their sampling
time, or at their age for ghost populations.
Horizontal lines represent population splits (solid black lines )
or
admixture events (dashed dark blue arrows), considered backward in time.
Periods of exponential population growth are shown as linear
population size changes
Intantaneous bottlenecks are represented by red dots, the size of
which is proportional to boottleneck intensity I = 1(2N), and the
bottleneck size for a single generation sis howsn in red aboth the dot,
and the time of the isntantaneous bottneck is shown in red on the right
of the dot.
modifying the R script
The R script should not be modified by
non R experts, except to specify the name of the par file
directly in the R script
However, this section can be modified by user to suit their needs and
taste
#--- Drawing variables --------
can be customized by user ------------------------------------------
#--- Colors migrMatCol="coral"
#Color of gene flow arrows admixCol="blue"
#Color of admixure events (single pulses of gene flow) popFusionColor="black"
#Color of population divergence lines popCol="gray95"
#Color of population size rectangles popBorderCol="black"
#Color of border of population size rectangles timeCol="tan4"
#Color of text for population size change ageCol="dodgerblue2"
#Color of text for population age textInstbotColor="red"
#Color of text size of instantaneous bottlenecks instbotColor=t_col(textInstbotColor)
#Color of dos indicating size of instantaneous bottlenecks
#--- Other parameters relative to
plots propLastsegment=0.05
#Ppercentage of page to keep on y axis above last event migMatNameProp=0.8
#Proportional size of text for migration matrices numbers migMatLineLength=0.3
#Size of separation line between times of use fo different migration
matrices timeProp=0.6
#Proportional size of text for times of population size change maxRadius=1/40
#Max size for pop size circle in legend minRadius=maxRadius/3
#Min size for pop size circle in legend arrowLength=0.2
#Length of curved arrows indicative of gene flow timeOffset=0.25
#X axis separation between consecutive times shown in legend migrOffset=0.05
#X axis separation between consecutive migration matrices numbers
shown in legend curvedArrowLTY=1
#Type of line for curved gene flow arrows drawLogPopSize=F
#Draw width of population sizes on a log scale or not plotMigrRates=T
#Show values of migration rates next to curved arrows plotNmValues=F
#Show Nm or m values (note that Nm values for growing pops
# are only shown for most recent pop sizes and may thus be irrelevant) migrRateTextSizeCEX=0.5
#Relative size of migration rate text instBotAbsSize=T
#Show absolute (T == 2N for 1 generation) or relative (F == t/2N) size
of instantaneous bottlenecks maxNumSpecialEvents=50
#Number of each special events that can be stored and plotted (e.g. pop
size changes, migration matrices, etc... )
#Define plot area size for PDF
(in inches?!) pdf.x.size=10 pdf.y.size=8
#------------------- end of
customizable section ---------------------------------------------------
If you run the script from R studio, you can also modify a
few additional parameters, like
#--- Set your own
file and parameters printPDF=F #Specify the working
directory here
setwd("D:/Users/Laurent/Dropbox/fastsimcoal/ParFileViewer") parFileName=
"3PopExpBot20Mb-v2.par" popLabels=c("Pop1",
"Ghost", "Pop2","Pop3")
usePopLabels=T #Use
popLabels on x axis, if "F" then plots deme numbers 0 1 2 3 etc...
genTime=1
#Arbitrary generation time (if genTime !=1 then time is given in years)
fixMaxTime=T
#Allow one to plot only a given time scale up to maxTimeToPlot
maxTimeToPlot=8000 #Upper limit for time scale
if fixMaxTime==T
R experts can of course customize the rest of the R script for their
own needs.