fast sequential Markov coalescent
simulation of genomic data under complex evolutionary models
Visual inspection of the the validity of modeled scenarios
Building a complex model in par files can be difficult. Unfortunately,
we have not been able to provide an easy way to construct these input
files. However, we have written an R program called called ParFileInterpreter-v6.3.r to
help visualize the scenario you have modeled.
executing the script
To do this you need to run the script from the R console or open it in RStudio and run it from there.
Alternatively, you can copy the script in the directory where you have
your par file and type the command
    Rscript
ParFileInterpreter-v6.3.r test.par
This assumes that the program Rscript is in a folder in your path and
that your scenario is described in the filetest.par
Note that the script requires to install two non-default R
libraries: plotrix and diagram
By default, the scenario will be drawn in a pdf file called <par file name>.pdf, where <par file name> issimply the name of your par file.
In the above example, it would create a pdf file called test.par.pdf
pdf file
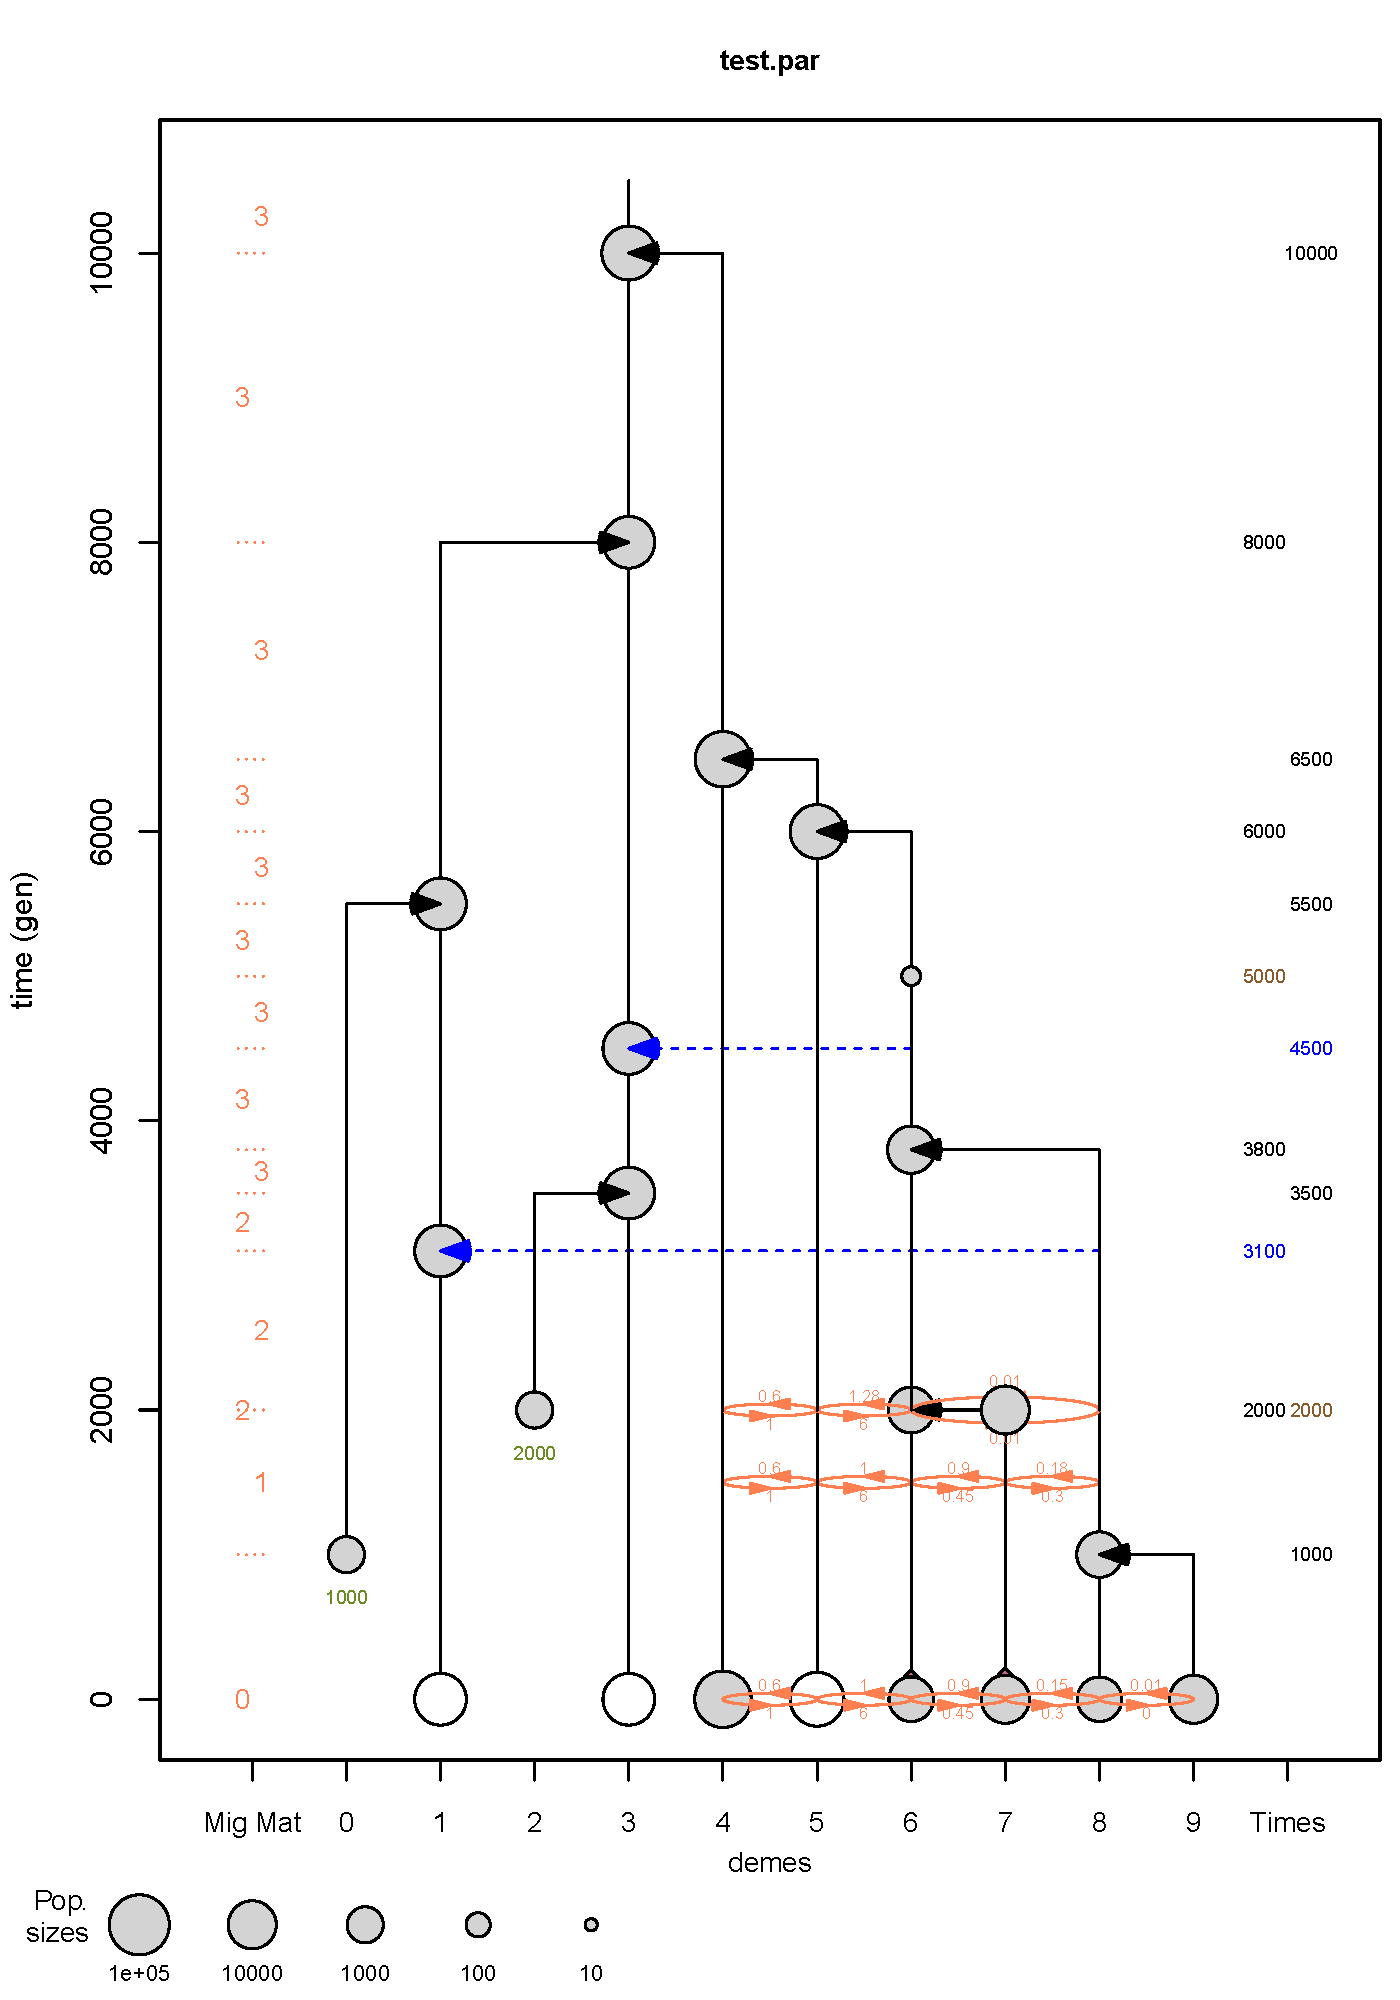
For instance, the analysis of the file test.par leads to test.par.pdf
shown below
symbols
In this pdf, circles represent populations. Gray circles represent
sampled populations, and white circles represent non-sampled "ghost"
populations. The population (deme) numbers on the x axis correspond to
those in the par file. The area of the circles is proportional to the
population sizes.
The numbers in the rightmost column correspond to the times of
historical events, which can be population splits (in black), episodes
of gene flow (in blue), or population resizes (in brown).
The orange arrows represent migration rates (in Nm
units), with direction indicating flow backward in time. Note that the
leftmost column indicates the migration matrix number used in the par
file at a given time.
The age of demes sampled in the past are shown below the population
circles.
Horizontal arrows represent population splits (solid black arrows) or
admixture events (dashed blue arrows), considered backward in time.
Pink arrows on top of population circles (like above deme 6 and 7
above) indicate onsets of exponential growth (or decline).
modifying the R script
The R script should not be modified by
non R experts, except to specify the name of the par file
directly in the R script
if(length(args)) {

  parFileName=args[1]

} else {

  #REPLACE BY THE NAME OF THE
PAR FILE YOU WANT TO ANALYSE

  parFileName="test.par"

}
R experts can of course customize the R scripts for their own needs.