 |
 |
fast sequential Markov coalescent simulation of genomic data under complex evolutionary models |
benchmarks
We have performed a few comparisons of fastsimcoal with ms, simcoal2 or MaCSspeed comparison of fastsimcoal (January 2013), ms, simcoal2 and
MaCs
datasets
The following test data sets were used in our speed comparisons|
|
No. of populations |
Diploid
population size |
Migration rate |
Mutation rate |
Recombination rate |
Sample size per
population |
|
1popNoRec |
1 |
12500 |
|
2×10⁻⁸ |
0 |
2000 |
|
1popSmallSample |
1 |
12500 |
|
2×10⁻⁸ |
1.2×10⁻⁸ |
20 |
|
1popLargeSample |
1 |
12500 |
|
2×10⁻⁸ |
1.2×10⁻⁸ |
2000 |
|
2popNoRec |
2 |
6250 |
0.001 |
2×10⁻⁸ |
0 |
1000 |
|
2popSmallSample |
2 |
6250 |
0.001 |
2×10⁻⁸ |
1.2×10⁻⁸ |
10 |
|
2popLargeSample |
2 |
6250 |
0.001 |
2×10⁻⁸ |
1.2×10⁻⁸ |
1000 |
The population, mutation and recombination parameters correspond to those used by Chen et al. (2009) in their comparison of ms to MaCS.
results
The results reported below are average CPU time per run expressed in
seconds. All runs were run on a Linux cluster made up of 2.6GHz AMD
Opterons with 4 GB of RAM and 74 GB HD.|
Data set |
No. of replicates |
Sequence length |
Program |
||
|
ms |
MaCS |
fastsimcoal |
|||
|
1popNoRec |
1000 |
1 Mb |
1.1 |
11.1 |
9.5 |
|
100 |
10 Mb |
9.6 |
107.0 |
72.9 |
|
|
100 |
100 Mb |
147.9 |
1319.5 |
1038.1 |
|
|
2popNoRec |
1000 |
1 Mb |
1.2 |
12.5 |
9.3 |
|
100 |
10 Mb |
8.9 |
128.1 |
71.5 |
|
|
100 |
100 Mb |
161.2 |
1513.2 |
1099.9 |
|
Without recombination, ms is much faster than the two other programs based on the SMC’ approximation, and fastsimcoal is becomes increasingly faster than MaCS with larger recombination rates and with migration.
|
Data set |
No. of replicates |
Sequence length |
Program |
||
|
ms |
MaCS |
fastsimcoal |
|||
|
1popSmallSample |
1000 |
1 Mb |
0.344 |
0.242 |
0.095 |
|
100 |
10 Mb |
159.246 |
2.618 |
0.460 |
|
|
100 |
100 Mb |
x |
26.124 |
4.364 |
|
|
2popSmallSample |
1000 |
1 Mb |
0.378 |
0.907 |
0.152 |
|
100 |
10 Mb |
165.507 |
9.094 |
1.080 |
|
|
100 |
100 Mb |
x |
97.876 |
10.559 |
|
x : ms crashed
For small sample sizes (total n=20) and with recombination, the SMC’
based programs are becoming much faster than ms, which
fails to run for 100Mb sequences. For such small sample
sizes, fastsimcoal is 2.5 to 9.3
times faster than MaCS. For MaCS and fastsimcoal, computing time increases approximately
linearly with
sequence length, as expected.
|
Data set |
No. of replicates |
Sequence length |
Program |
||
|
ms |
MaCS |
fastsimcoal |
|||
|
1popLargeSample |
1000 |
1 Mb |
3.7 |
28.1 |
25.2 |
|
100 |
10 Mb |
x |
327.5 |
235.7 |
|
|
100 |
100 Mb |
x |
3700.8 |
2635.4 |
|
|
2popLargeSample |
1000 |
1 Mb |
3.9 |
33.3 |
25.9 |
|
100 |
10 Mb |
x |
393.5 |
240.6 |
|
|
100 |
100 Mb |
x |
4311.1 |
2684.7 |
|
x : ms crashed
For large sample sizes (total n=2000), ms is actually faster than the two other programs for a “small” sequence of 1Mb, but failed to run successfully for longer sequences. For these large sample sizes, fastsimcoal is 1.2 to 1.8 times faster than MaCs. fastsimcoal computing time still increases approximately linearly with sequence length, which is not the case ofMaCS, which becomes slightly penalized by larger sequences. Note however, that for 1Mb and 10Mb, we used fastsimcoal options allowing it to keep all simulated sites in memory before writing them to the output file, which was not possible for 100Mb sequences, which would use up too much memory.
patterns of molecular diversity
Number of pairwise difference
We report below a comparison of the patterns of diversity within and between populations simulated by ms, MaCs and fastsimcoal.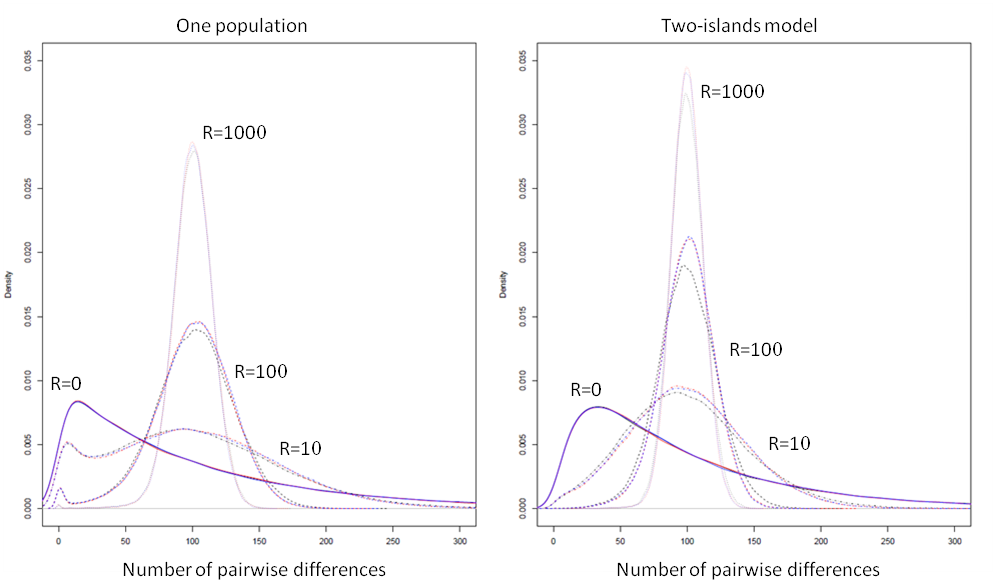
ms results are shown with a black line, MaCs with a red line, and fastsimoal, with a blue line. In all cases, the empirical distributions of the number of pairwise differences were computed from 100,000 simulations of the coalescent of 2 genes. The 2 genes were drawn from a single population for the one-population case, and were drawn each in a different population in the two-island model case. We used the following population parameters: for the one population case; and for the two-island case; and was varied between 0 and 1000, as shown above. In all cases, MaCS and fastsimcoal lead to identical distributions, which is expected as they are both based on the same SMC’ approximation.
In absence of recombination MaCS and fastsimcoal give also exactly the same distributions as ms, but are just running 7-10 times slower, as was seen in the previous section. With very high recombination rates, the SMC-based approximation of MaCS and fastsimcoal is extremely close to the ancestral recombination graph (ARG) implemented in ms, in keeping with previous results (McVean and Cardin, 2005). For "intermediate" recombination rates (R=10, R=100), some slight differences do emerge between ARG- and SMC-based programs, and these differences are slightly more pronounced in the 2-island model. However, it seems that these differences are much less than differences due to the choice of different demographic, mutation, or recombination parameters.
patterns of linkage disequilibrium
simcoal2 vs fastimcoal ver 1
Here, we report a comparison of the average LD (as measured by r2) between the ARG-based simcoal2 program and fastsimcoal ver 1.0 (SMC'-based) between two SNP markers located at a given recombination distance expressed in R units.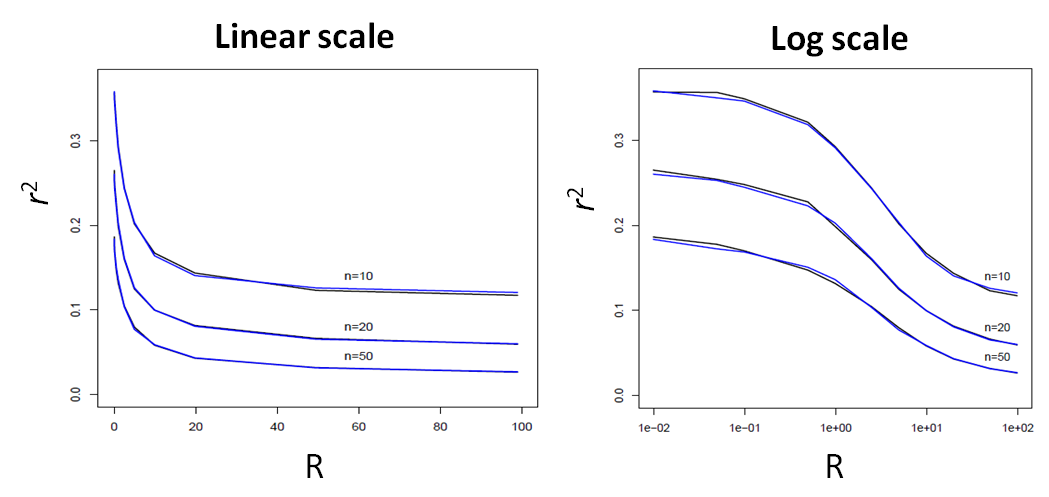
simcoal2 vs fastimcoal ver 2.51
Here, we report a new comparison of the average LD (as measured
by r2)
between the
ARG-based simcoal2
program
and fsc251
(SMC'-based) between two SNP markers located at a given recombination
distance expressed in R units. 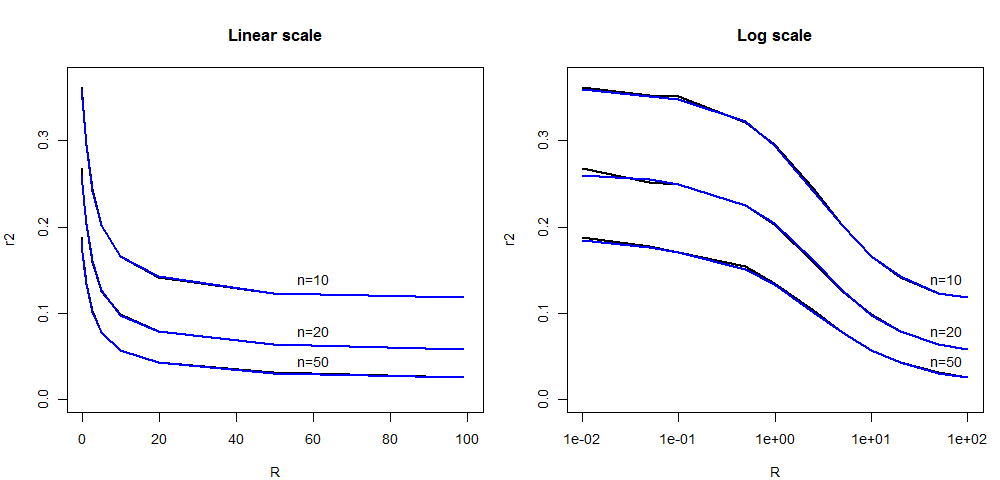
speed comparison of fastsimcoal ver 2.5 (July 2014) and fastsimcoal21 (December 2013)
|
|
Programs |
||||||
|
|
|
|
fsc25 |
|
fsc25 |
||
|
Data set |
fastsimcoal21 |
|
-c1 -B1 |
gain |
|
–c8 –B8 |
gain |
|
DNA sequence constant population of 10,000 diploids, n=100) |
|
|
|
|
|
|
|
|
10 x 100000 x 100 bp no rec |
18.08 s |
|
12.65 s |
1.43 |
|
3.85 s |
4.70 |
|
10 x 1000000 x 100 bp no rec |
26.04 s |
|
22.97 s |
1.13 |
|
8.50 s |
3.06 |
|
10 x 10 Mb with rec |
10.47 s |
|
10.34 s |
1.01 |
|
10.37 s |
1.01 |
|
1 x 100 Mb with rec |
13.59 s |
|
12.88 s |
1.06 |
|
13.62 s |
1.00 |
|
FREQ (parameter estimation) |
|
|
|
|
|
|
|
|
1PopExpInst20Mb -n100000 -l5 |
14.53 s |
|
8.14 s |
1.79 |
|
2.53 s |
5.74 |
|
2PopDiv20Mb -n100000 -l5 |
27.77 s |
|
20.91 s |
1.33 |
|
4.91 s |
5.66 |
|
2PopDivMigr20Mb -n100000 -l5 |
48.94 s |
|
35.54 s |
1.38 |
|
8.45 s |
5.79 |
|
3PopExpBotm -n10000 -l5 |
200.48 s |
|
167.66 s |
1.20 |
|
35.63 s |
5.63 |
|
3PopExpBotm mSFS -n10000 -l5 |
123.39 s |
|
111.96 s |
1.10 |
|
24.00 s |
5.14 |
|
10Pop2ContiIsl 1 -n1000 -l5 |
191.11 s |
|
129.35 s |
1.48 |
|
32.54 s |
5.87 |
|
10Pop2ContiIsl 2 -n1000 -l5 |
182.18 s |
|
121.07 s |
1.50 |
|
32.38 s |
5.63 |
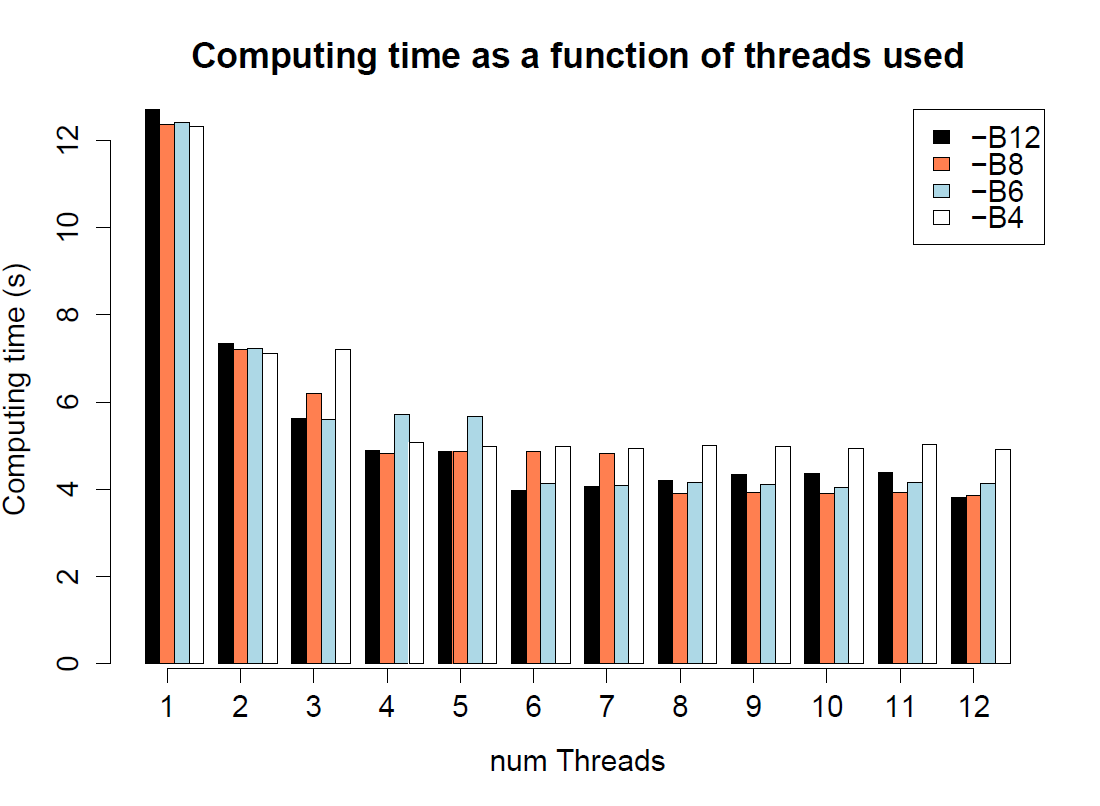
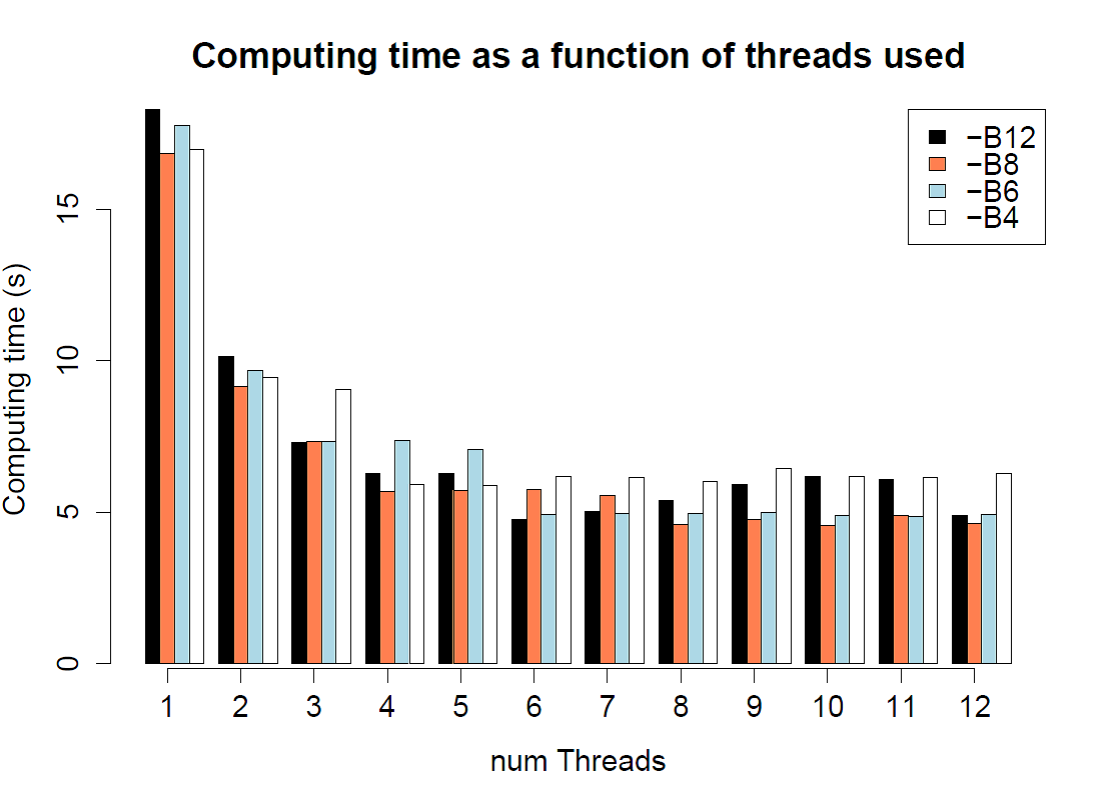
speed comparison for different number of threads (-c) and batches (-B) in fsc25
|
./$fsc25 -i 1PopDNAnoRec10Mb.par -n10 -I -x
--seed 1234
10 simulations of 100,000 segments of 100 bp |
 |
|
./$fsc
-t 1PopExpInst20Mb.tpl -e 1PopExpInst20Mb.est -d -M0.001 –n200000
–N200000 -I –l5 –L5 --seed 1234 –q
|
 |
speed comparison : from fastsimcoal ver 1.0 to ver 2.5.1
We report here the total computation time taken to do a given number of simulations in 1 or 2 populations of samples size 10 or 1000 gene copies. We simulate DNA sequences with or without recombination, with a mutation rate of 2e-8 per bp.Other parameters:
- Population sizes N=12500 diploids
- Migration rate between populations: 0.001 per gene copy per generation
- All simulations were performed with option -k200000, and using a
single thread (-c1) and a single batch (-B1) for versions 2.5 and 2.51
No recombination case (r=0)
Num. Sims |
n |
Seq.
Length |
fsc v.1 |
fsc v2.1 |
fsc v 2.5 |
fsc v 2.51 |
|
| 1pop | 1000 | 10 | 1Mb | 1.67s | 1.61s | 2.79s | 2.57s |
| 1pop | 1000 | 10 | 10Mb | 15.64s | 16.88s | 31.15s | 29.08s |
| 1pop | 100 | 10 | 100Mb | 17.45s | 27.74s | 16.78s | 16.60s |
| 1pop | 10 | 1000 | 1Mb | 9.39s | 9.02s | 6.23s | 5.54s |
| 1pop | 10 | 1000 | 10Mb | 1m25s | 1m35s | 1m40s | 1m38s |
| 1pop | 3 | 1000 | 100Mb | 5m51s | 7m12s | 4m56s | 4m42s |
| 2pop |
100 |
10 |
1Mb |
7.29s |
7.44s |
4.42s |
6.78s |
| 2pop | 100 |
10 |
10Mb |
1m08s |
1m16s |
1m06s |
1m08s |
| 2pop | 10 |
10 |
100Mb |
1m58s |
2m08s |
1m11s |
1m10s |
| 2pop | 10 |
1000 |
1Mb |
6m38s |
7m11s |
7m23s |
6m42s |
| 2pop | 10 |
1000 |
10Mb |
65m21s |
77m14s |
73m31s |
67m06s |
| 2pop | 3 |
1000 |
100Mb |
87m00s |
92m04s |
74m31s |
69m00s |
Recombination case (r=1.2e-8 between bp)
Num. Sims |
n |
Seq.
Length |
fsc v.1 |
fsc v2.1 |
fsc v 2.5 |
fsc v 2.51 |
|
| 1pop | 100 | 10 | 1Mb | 1.69s |
1.28s |
1.45s |
0.56s |
| 1pop | 100 | 10 | 10Mb | 13.04s |
12.68s |
13.52s |
5.57s |
| 1pop | 10 | 10 | 100Mb | 14.26s |
13.83s |
11.96s |
5.09s |
| 1pop | 10 | 1000 | 1Mb | 46.82s |
49.17s |
44.92s |
16.38s |
| 1pop | 10 | 1000 | 10Mb | 7m52s |
7m53s |
8m17s |
3m06s |
| 1pop | 3 | 1000 | 100Mb | 27m42s |
26m36s |
26m33s |
9m22 |
| 2pop |
100 |
10 |
1Mb |
22.86s |
23.59s |
19.36s |
14.55s |
| 2pop | 100 |
10 |
10Mb |
3m57s |
3m58s |
2m03s |
1m58s |
| 2pop | 10 |
10 |
100Mb |
3m55s |
3m57s |
3m12s |
2m31s |
| 2pop | 10 |
1000 |
1Mb |
3m52s |
3m54s |
3m51s |
1m34s |
| 2pop | 10 |
1000 |
10Mb |
38m41s |
39m07s |
38m19s |
15m45s |
| 2pop | 3 |
1000 |
100Mb |
122m23s |
123m16s |
116m26s |
53m20s |
Main changes:
- Version 1 was limited to the pure simulation of genetic data
- With version 2, we introduced the possibilty to infer parameters from the site frequency spectrum, making many objects a bit more complex
- With version 2.5, we introduced multi-threading, removing many static object members, implying some cost for monothreaded computations.
- With version 2.5.1, we introduced a new implementation of
recombination under the SMC' algorithm, making is drastically faster
(2-3x performance gain).

 |